
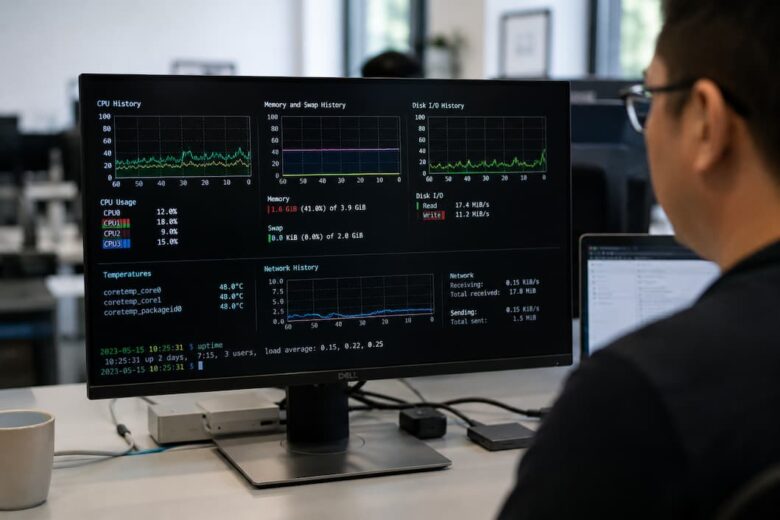
CPU vs RAM vs Disk: How to Identify the Real Performance Bottleneck

The true villain behind sluggish Linux servers is often concealed. Users are seeing “the server is slow,” apps are timing out, backups are running past their maintenance windows, or virtual machines are lagging. The knee-jerk reaction is to increase the hardware or add more RAM, but those adjustments don’t always boost speed because the real barrier is somewhere else.

The CPU use does not imply the processor is overburdened. Memory use can be high without there being a memory shortage, and disk activity can be elevated without there being sluggish storage. Linux actively caches filesystem data, arranges processes, and queues I/O operations to enhance throughput. Raw utilization figures are deceptively easy to misinterpret.

The aim is not to see which resource is the busiest, but rather which resource is preventing the system from making forward progress. Understanding that limiting factor will help minimize needless hardware upgrades, cut down on time debugging, and assist with pinpointing answers rather than costly guesswork. This book covers the difference between CPU, memory, and storage bottlenecks; how Linux reports resource strain; and how to identify the root reason for poor performance before taking action.

What Is a Performance Bottleneck?

A performance bottleneck is a system resource constraining overall throughput. Any job requires processing time, memory, storage, and, often, networking. Work proceeds at the rate of the slowest element.

A CPU-bound video encoding task may spend most of its time crunching, whereas a database query running over millions of rows will spend most of its time waiting for storage. If a virtualization host with dozens of guests appears to be CPU-bound, the true problem may be memory pressure, causing continual page reclamation.

The point is, high usage alone is not an indication of a bottleneck. On modern Linux systems, resources are purposely kept busy. The question is, are there processes waiting for that resource?

Why Resource Utilization Can Be Misleading

It’s a classic troubleshooting mistake to assume the problem is where the highest usage statistic is.

Take these samples:

  • If jobs are done efficiently, 95% CPU use while video transcoding could be quite normal.
  • Filesystem cache is usually not an issue of memory exhaustion. High memory utilization usually is the issue.
  • High disk throughput during backups can be a sign of healthy storage running at full capacity.

Linux tries to use the hardware in the best way it can. Unused memory becomes cache, idle CPUs run background activities, and storage queues are kept full to boost throughput. Instead of “Which resource is busy?” ask “Which resource are applications waiting for?”

Understanding CPU Bottlenecks

CPU bottlenecks occur when processors cannot execute work as quickly as it arrives. Applications spend most of their time actively running instead of waiting on storage or memory.

Typical symptoms include the following:

  • Sustained high CPU utilization
  • Increased application response times
  • Growing run queues
  • High user or system CPU percentages
  • Slow compilation, compression, or encryption workloads

Not all CPU usage is equal.

User CPU reflects application execution, while system CPU represents kernel activity such as networking, interrupt handling, or filesystem operations. A system dominated by kernel CPU may indicate inefficient drivers, excessive interrupts, or networking overhead rather than computational demands.

Load average is also frequently misunderstood. A high load average simply indicates tasks that are waiting to run or are in uninterruptible sleep. It does not automatically mean the CPU is overloaded.

How to Verify a CPU Bottleneck

Begin by examining overall processor utilization:

top

or

htop

Look for:

  • consistently high CPU usage across multiple cores
  • growing run queues
  • processes consuming significant processor time
  • sustained high load averages

If CPU usage remains near maximum while processes continue running rather than sleeping on I/O, processor capacity may genuinely be limiting performance.

For more detailed statistics:

mpstat -P ALL 1

This displays per-core utilization, helping identify uneven scheduling or single-threaded workloads that saturate one core while others remain mostly idle. High CPU utilization alone is insufficient evidence. Verify that applications are actively computing rather than being blocked waiting for another subsystem.

Recognizing Memory Bottlenecks

Linux treats unused memory as wasted. Consequently, seeing RAM utilization above 90% is completely normal. The operating system aggressively caches recently accessed filesystem data because reclaiming cache is significantly faster than reading data from disk again. A true memory bottleneck occurs only when Linux cannot satisfy allocation requests without reclaiming memory aggressively or swapping pages to disk.

Common symptoms include:

  • Swap activity
  • Page reclaim spikes
  • OOM killer events
  • Applications unexpectedly terminating
  • Large latency increases under load

The out-of-memory (OOM) killer represents a last resort. If it terminates processes, the system has already experienced severe memory pressure.

How to Verify Memory Pressure

Start with:

free -h

Do not focus solely on the used column.

Instead, examine:

  • Available memory
  • Swap usage
  • Cached memory

Healthy Linux systems often report very little “free” memory because most unused RAM is serving as cache.

For continuous monitoring:

vmstat 1

Pay particular attention to:

  • si (swap in)
  • so (swap out)

Persistent swap activity during normal workloads strongly suggests memory pressure.

Also inspect kernel logs:

dmesg

Look for:

  • OOM killer events
  • allocation failures
  • page reclaim warnings

These provide stronger evidence than memory utilization percentages alone.

Understanding Disk I/O Bottlenecks

Storage bottlenecks are among the most commonly misdiagnosed Linux performance problems. Administrators often see high CPU load and assume the processor is overloaded, when in reality processes are spending most of their time waiting for disk operations to complete. Unlike CPU-intensive workloads, I/O-bound applications perform relatively little computation. Instead, they repeatedly wait for reads and writes to finish before continuing execution.

Common symptoms include:

  • Slow application response times
  • Long database query execution
  • Delayed file transfers
  • Extended backup windows
  • High load average with relatively low CPU utilization
  • Applications appearing to “freeze” while waiting for storage

Traditional hard drives are especially susceptible because every random read requires physical head movement. Although SSDs and NVMe drives have dramatically reduced latency, storage can still become the limiting factor due to queue depth, controller limitations, RAID rebuilds, or saturated storage arrays.

How to Verify a Disk Bottleneck

A good starting point is iostat, which provides detailed disk performance statistics.

iostat -xz 1

Several fields deserve close attention.

  • %util indicates how busy the device is.
  • await measures of average request latency.
  • r/s and w/s show the number of read and write operations per second.
  • rkB/s and wkB/s display throughput.

High utilization alone isn’t necessarily a problem. A busy NVMe drive handling requests with very low latency is performing exactly as expected.

The warning signs are different:

  • high await values
  • rapidly increasing request queues
  • applications blocked in disk I/O
  • throughput remaining flat despite growing latency

If request latency rises while throughput stops increasing, storage has likely become the limiting resource.

Identify Which Processes Are Waiting

Finding a busy disk is only half the investigation. The next step is determining which application is responsible.

The iotop utility displays processes actively generating disk activity.

sudo iotop

Look for processes that continuously issue large numbers of reads or writes.

Typical examples include the following:

  • database engines
  • backup software
  • virtual machine images
  • indexing services
  • log processing
  • large file copies

If a single application monopolizes storage bandwidth, optimizing that workload often improves overall system responsiveness far more than upgrading hardware.

CPU Wait Time vs. CPU Utilization

One of Linux’s most useful—but frequently misunderstood—metrics is I/O wait (wa). CPU wait represents processor time spent idle because runnable processes are waiting for storage operations to complete.

For example:

  • CPU utilization: 18%
  • I/O wait: 42%
  • Load average: 16

Many administrators incorrectly conclude that the CPU is underutilized.

In reality, the processors have no work to execute because applications are blocked waiting for disk operations.

High I/O wait generally points to:

  • saturated storage
  • slow disks
  • overloaded RAID arrays
  • failing drives
  • storage controller issues
  • remote storage latency

The CPU is idle—not because demand is low, but because storage cannot provide data quickly enough.

Using Pressure Stall Information (PSI)

Traditional utilization metrics show how busy hardware is, but they don’t reveal how long applications spend waiting. Modern Linux kernels provide Pressure Stall Information (PSI), which measures resource contention directly.

PSI statistics are available under:

/proc/pressure/

The available files include:

  • cpu
  • memory
  • io

For example:

cat /proc/pressure/cpu

Instead of reporting utilization, PSI reports the percentage of time workloads were delayed because sufficient resources were unavailable. This makes PSI particularly valuable when diagnosing intermittent slowdowns that don’t coincide with obvious utilization spikes. Growing memory pressure, sustained CPU pressure, or increasing I/O pressure often identifies the real bottleneck long before conventional monitoring detects a problem.

Distinguishing CPU, Memory, and Disk Bottlenecks

The following comparison helps identify the limiting resource more quickly.

Symptom CPU Memory Disk
CPU utilization Very high Moderate Often low
Load average High Moderate to high High
Swap activity No Yes Usually not.
I/O wait Low Moderate High
Application state Running Reclaiming memory Waiting for I/O
Primary fix More CPU or optimization More RAM or lower memory usage Faster storage or optimized I/O

Notice that a high load average appears in all three cases. Load average alone should never determine the diagnosis.

Performance Bottlenecks in Virtual Machines

Virtualization complicates troubleshooting because the guest operating system cannot always see the host’s resource constraints. A virtual machine may report low CPU utilization while the hypervisor delays scheduling due to oversubscribed physical CPUs.

Similarly, storage latency inside the guest may originate from:

  • overloaded host storage
  • competing virtual machines
  • snapshot chains
  • backup activity
  • SAN congestion

Whenever possible, compare guest metrics with host metrics. If every virtual machine slows simultaneously, the bottleneck almost certainly exists on the host rather than inside an individual guest.

Common Misdiagnoses

Performance investigations frequently fail because administrators focus on symptoms instead of resource contention.

Some of the most common mistakes include:

“Memory usage is 98%, so we need more RAM.”

Linux intentionally fills unused memory with a file system cache.

Unless memory pressure causes swapping or OOM events, high memory usage is usually healthy.

“Load average is 30, so the CPU is overloaded.”

The load average includes processes waiting for storage.

Always check CPU utilization and I/O wait before blaming the processor.

“CPU usage is low, so the server isn’t busy.”

Applications blocked on storage consume little CPU time.

Low utilization combined with high I/O wait often indicates the opposite.

“Adding more CPU cores will solve the problem.”

If storage is saturated or memory pressure forces constant reclaim, additional processors provide little benefit.

Hardware upgrades should always match the verified bottleneck.

A Practical Performance Troubleshooting Workflow

When users report that a Linux server is slow, avoid making assumptions right away.

Instead, follow a structured workflow:

  1. Measure CPU utilization using top a tool or.
  2. Check memory availability with free -h it.
  3. Review swap activity and OOM events.
  4. Measure storage latency using iostat.
  5. Identify disk-heavy processes.
  6. Review pressure stall information if available.
  7. Compare current metrics with historical baselines.
  8. Investigate recent workload or configuration changes before modifying hardware.

This approach identifies the limiting resource with far greater accuracy than relying on a single utilization graph.

Preventing Performance Bottlenecks

Reactive troubleshooting is important, but proactive monitoring prevents many performance problems from reaching production.

Consider monitoring:

  • CPU utilization and load average
  • CPU steal time on virtual machines
  • Available memory
  • Swap activity
  • Disk latency
  • Queue depth
  • SMART health statistics
  • Pressure Stall Information
  • Long-term performance trends

Alerting should focus on sustained resource pressure rather than brief utilization spikes, as short bursts are often normal for modern Linux systems. Capacity planning is equally important. Historical metrics make it easier to identify gradually increasing resource consumption before it begins affecting users.

Final Thoughts

To get to the underlying performance bottleneck, you need to understand how Linux controls CPU time, memory, and storage and not just look at utilization statistics. Your 95% utilization of the processor might be just fine, but a system with 20% CPU utilization can still be sluggish because apps are waiting for storage or memory to free up.

The best performance investigations begin with the question, “What resource are applications waiting for?” not, “What resource looks busiest?” CPU stats, memory stats, storage delay, and contemporary techniques like Pressure Stall Information all come together to provide you a far better overview of the system health.

By taking a scientific approach to performance problems, verifying each assumption with verifiable data, administrators may repair slowdowns faster, prevent unnecessary hardware upgrades, and develop Linux systems that stay responsive as workloads continue to expand.

Leave a Reply

Your email address will not be published. Required fields are marked *